The Impact of Extreme Weather Events on US Equities


Special Issue - EDHEC PhD in Finance Newsletter - June 2020
Article signed by Mark Siebert, EDHEC PhD (2016), Chief Risk Officer, Corporate & Institutional Banking Risk, National Australia Bank Limited, Hong Kong
The Impact of Extreme Weather Events on US Equities
In their Global Risks Report 2018, the World Economic Forum identifies extreme weather events as the number one global risk in terms of likelihood and the second in terms of impact — after weapons of mass destruction.
This article is an excerpt from a recent research paper on the impacts of Extreme Weather Events on US Equities authored by Dr. Matthew Lanfear, Professor Abraham Lioui and Dr. Mark Siebert.
The paper entitled “Market Anomalies and Disaster Risk: Evidence from Extreme Weather Events”, is published in the Journal of Financial Markets, and looks at the abnormal effects on stock returns and illiquidity across portfolios of stocks during extreme weather events.
The purpose of the paper was to assess whether extreme weather events matter for market anomalies and the returns on the related factors. The factors are long/short portfolios of stocks sorted on a selection of characteristics, such as size, return-on-equity, and so on. The failure of the CAPM to explain the returns on these factors is an anomaly. The asset management industry has evolved towards factor investing, more noticeably in the recent decade. In parallel, a multitude of academic papers offered new factor models to explain the cross-section of asset prices. Given the huge interest from the finance industry, as well as academics, it is important to understand whether disaster risk may be one source of the returns on the factors.
In the paper, instead of using disasters related to macro-economic variables such as consumption, output or total factor productivity, the authors used as a natural experiment the occurrence of a specific type of extreme weather event — North Atlantic hurricanes. Using landfall hurricanes instead of disasters related to aggregate economic variables to assess the responsiveness of factor returns to extreme events has one significant advantage concerning data availability. Such extreme weather events are recurrent, which mitigates the main problem of rare events related to aggregate variables: that they are rarely realized and thus complicated to calibrate.
Data
U.S. landfall Atlantic hurricane data, over the period 1990 to 2017, was used as a proxy measure for extreme weather events. The data comprises a total of 39 hurricane events of which 25 were classified as major hurricanes (Categories 3 to 5). In aggregate, these 39 landfall hurricanes resulted in over 7,000 deaths and caused over US$700bn in damages (in 2017 equivalent dollars).
Stock data comprised all common stocks traded on the NYSE, NYSE MKT (formerly AMEX), and NASDAQ during the same period.
Stocks were sorted into portfolios according to five characteristics: market equity (ME), book-to-market ratio (BE/ME), momentum, return-on-equity (ROE) and investment-to-assets ratio (I/A).
For the ME characteristic, stocks were placed into three size groups: microcaps (micro), small stocks (small) and big stocks (big). Breakpoints were determined based on the 20th and 50th percentiles of end of June ME values for NYSE stocks only. For comparative purposes, the authors also created a portfolio of all stocks other than micro (all-but-micro) which combines the small and big portfolios and a market portfolio (market), which combines micro, small and big portfolios.
For the remaining characteristics, stocks were sorted into quintile portfolios to ensure there were sufficient stocks in each portfolio. Breakpoints for the quintiles were determined based on the 20th, 40th, 60th, and 80th percentiles. The choice of quintile is mainly dictated by the extreme variability of the number of stocks in the portfolios when using NYSE breakpoints while using stocks from NYSE, NYSEMKT, and NASDAQ. Quintile portfolios are stable, and stocks are evenly spread across the portfolios. Finally, while the authors studied the behavior of the five portfolios for each characteristic, they also systematically provided tests of the spread between lower and higher quintile. This way, one is informed of the impact on the long/short factor, as well as each leg of the factor’s return.
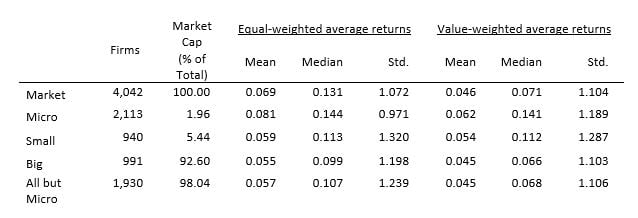
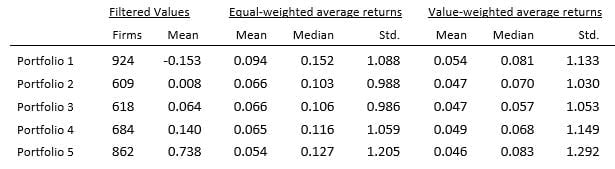
Table 1 presents descriptive statistics for the average daily equal- and value-weighted returns for portfolios of stocks sorted by ME into micro/small/big portfolios. Consistent with the literature, micro-cap stocks represent an exceedingly small fraction of total market capitalization (1.96%), although they represent more than 50% of the total stocks. Small stocks represent 25% of total stocks but only 5.44% of market capitalization compared to 92.60% for big stocks. The return patterns have the expected pattern, with a daily mean return for micro of 0.081% (EW) or 0.062% (VW), while at the same time for the rest of the market the figures are 0.057% and 0.045%. The authors also observe a size effect when using VW, although it is unlikely to be an important driver of the results for other anomalies given the incredibly low portion of market capitalization of micro and small stocks.
Table 1: Descriptive statistics of returns for portfolios sorted by market equity. This table presents descriptive statistics for mean daily percentage returns on portfolios of NYSE, NYSE MKT, and NASDAQ stocks sorted by market equity for the January 1990 to December 2017 period. Stocks are ranked by size as of June 30 and allocated to portfolios according to breakpoints determined using the NYSE only. Portfolios are rebalanced for each June 30.
Tables 2, 3, 4 & 5 report the summary statistics for the quintile portfolios related to the other characteristics. The patterns are consistent with literature for each characteristic. Value stocks have a higher average daily return than growth stocks: 0.126% vs. 0.025% (EW) and 0.079% vs. 0.027% (VW). High momentum portfolios outperform low ones and average daily returns and spreads between quintiles are higher in the EW case. High ROE also translates into better performance: high ROE quintile portfolios realize a higher average return than low ones. Finally, conservative stocks with a low I/A ratio have higher returns than aggressive ones with a high I/A ratio. Overall, our daily summary statistics produce well-known patterns.
Table 2: Descriptive statistics of returns for portfolios sorted by book-to-equity ratio. This table presents descriptive statistics for mean daily percentage returns on quintile portfolios of NYSE, NYSE MKT, and NASDAQ stocks sorted by book-to-market ratio for the January 1990 to December 2017 period. At the end of June of each year t, the authors split stocks into quintiles based on book-to-market ratio, which is the book equity for the fiscal year ending in calendar year t − 1 divided by the market equity at the end of December of t − 1. Monthly quintile returns are calculated from July of year t to June of t + 1, and the quintiles are rebalanced in June of t + 1.
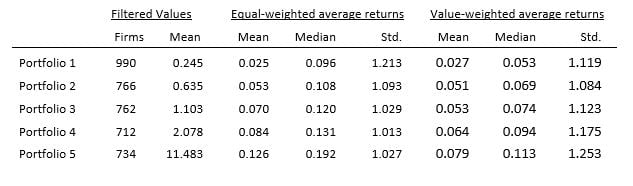
Table 3: Descriptive statistics of returns for portfolios sorted by momentum. This table presents descriptive statistics for mean daily percentage returns on quintile portfolios of NYSE, NYSE MKT, and NASDAQ stocks sorted by momentum for the January 1990 to December 2017 period. The authors split all stocks into quintiles at the beginning of each month t based on their prior 11-month returns from month t − 12 to t − 2. Skipping month t − 1, the authors calculate monthly quintile returns for month t. All the quintiles are rebalanced at the beginning of month t + 1.
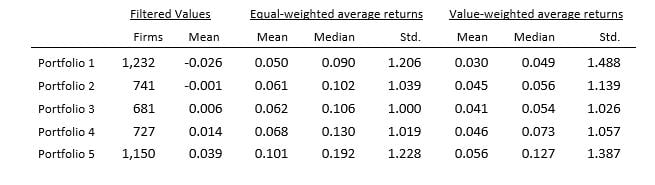
Table 4: Descriptive statistics of returns for portfolios sorted by return-on-equity. This table presents descriptive statistics for mean daily percentage returns on quintile portfolios of NYSE, NYSE MKT, and NASDAQ stocks sorted by return-on-equity for the January 1990 to December 2017 period. At the beginning of each month t, the authors sort all stocks into quintiles based on their most recent past ROE. Monthly quintile returns are calculated for the current month t. The quintiles are rebalanced monthly.
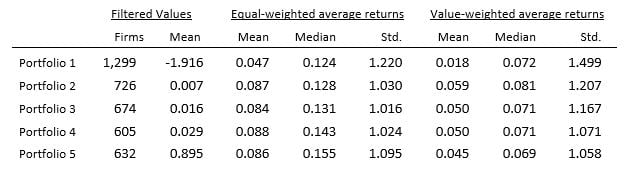
Table 5: Descriptive statistics of returns for portfolios sorted by investment-to-assets. This table presents descriptive statistics for mean daily percentage returns on quintile portfolios of NYSE, NYSE MKT, and NASDAQ stocks sorted by investment-to-assets for the January 1990 to December 2017 period. At the end of June of each year t, the authors sort stocks into quintiles based on investment-to-assets (I/A), which is measured as total assets for the fiscal year ending in calendar year t − 1 divided by total assets for the fiscal year ending in t − 2 minus one. Monthly quintile returns are computed from July of year t to June of t + 1, and the quintiles are rebalanced in June of t + 1.
Methodology
The authors use standard event study methodology in which a forecasting model is applied over a defined period to estimate the model parameters, which are then used to calculate abnormal values during the event window as the difference between realized values and expected values. The statistical significance of the abnormal effect is evaluated using parametric and nonparametric tests to assess whether they vary significantly from their expected value of zero. The event date is the day that a hurricane first makes landfall in the U.S. or, if a non-trading day, the first day of trading after landfall.
Estimation period
Many studies define the estimation period as a fixed number of trading days immediately prior to the event window; frequently 250 days, which represents approximately one full trading year. However, because multiple hurricanes occur in some years, the authors consider an alternative method for defining the estimation period to avoid the confounding influence of other hurricanes on the parameter estimates. The authors define the estimation period as the trading days outside of the North Atlantic hurricane season, preceding the current hurricane season. Specifically, December 1 to May 31 preceding the hurricane event, equal to approximately 180 calendar days, or 125 trading days. By using this estimation period, the authors avoid contaminating estimates with the effects of other hurricanes.
Event window
The event study was performed over five different event windows to assess the potential impact of the hurricane events pre-, during, and post-landfall as well as over the full period from hurricane formation through to 30-days post landfall (denoted [F,+30]).
Whilst there are likely many confounding events occurring within the event window, the influence of any individual confounding event is reduced by considering the mean abnormal effect using portfolios of stocks rather than individual stocks, and by aggregating effects across all hurricanes occurring over an extended time period. Industry-wide confounding events (e.g., regulatory changes in the finance and insurance industries), will be mitigated by averaging portfolio impacts over the 28-year sample period.
Abnormal returns - Model
The objective was to see how the returns from the anomaly are affected by extreme weather events. Using a multi-factor model would eliminate the portfolios’ anomalous excess returns. The authors therefore used single-factor CAPM to measure abnormal returns:
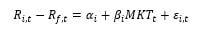
where  is the daily return (including dividends) on stock
  is the risk-free rate,
  is the excess return on the market (computed as the value-weighted return on all NYSE, NYSE MKT, and NASDAQ stocks minus the one-month Treasury bill rate), and
  is the idiosyncratic return.
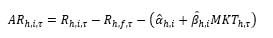
For a given hurricane h and stock i, the authors compute abnormal returns for day  during the event window as the difference between the actual excess returns and the expected excess returns estimated from the model, i.e.:
The average cumulative abnormal return (ACAR) over the event window (where  is the first day of the event window and
  is the last day) is then:

Abnormal returns, as well as other abnormal quantities, are computed at the stock level and then averaged at the portfolio level. To guarantee that abnormal effects are representative of the quintile portfolio as a whole and not driven by some relatively low volatility, large market capitalization stocks, the authors complement the standard value-weighted approach by also constructing equal-weighted abnormal returns for the quintile portfolios.
For a particular portfolio p, and in the equal-weighted case, the portfolio average cumulative abnormal returns (PACAR) across all hurricanes is defined as:
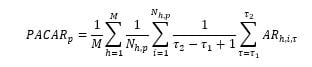
where M is the number of hurricanes and  the number of stocks in portfolio p for hurricane h. A similar formula is used for the value-weighted case.
Testing
To test the hypothesis that abnormal returns are different from zero, the authors use prominent parametric and non-parametric tests. All parametric tests rely on the assumption of normality, which may, in fact, be a strong assumption. Accounting for non-normality is particularly important for our study which includes a large period post the Global Financial Crisis. Furthermore, since NASDAQ stocks represent a large fraction of our sample, one needs to consider that traditional parametric tests may reject the null hypothesis too often when NASDAQ stocks are examined. Accordingly, the authors complement the parametric test using the non-parametric rank test.
Findings
The paper computes both value-weighted (VW) and equal-weighted (EW) results for the Mean Daily Returns (MDR) and the PACAR for all five event windows for each of the portfolios and for each characteristic. The paper also presents results contrasting the effects of minor and major hurricanes.
The full results are not repeated here, instead Tables 6, 7 & 8 report summary results for abnormal returns of portfolios for the [F,+30] event window using only major hurricane data. Panel A of the tables reports the EW findings and Panel B the VW findings.
Table 6: This table presents Mean Daily Returns (MDR) and Portfolio Average Cumulative Abnormal Returns (PACAR) for portfolios of stocks sorted by Market Equity (ME).
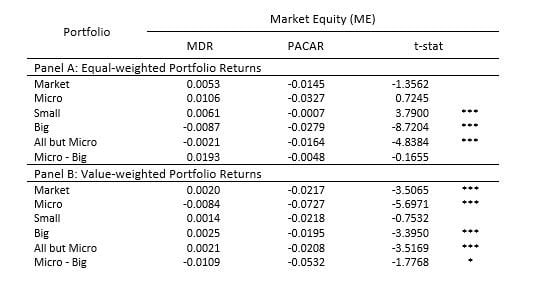
Table 7: This table presents Mean Daily Returns (MDR) and Portfolio Average Cumulative Abnormal Returns (PACAR) for portfolios of stocks sorted by Book to Market Ratio (BE/ME) and Momentum.
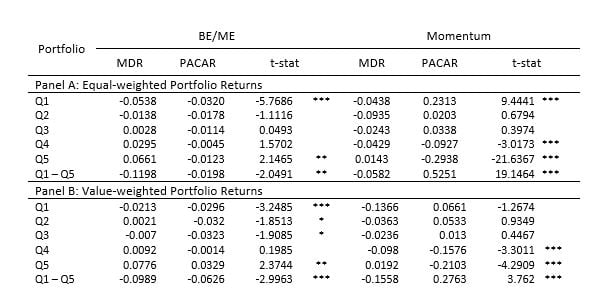
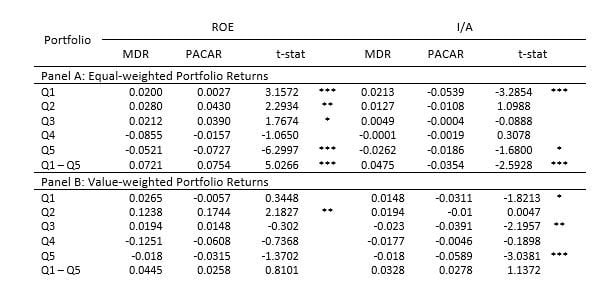
Table 8: This table presents Mean Daily Returns (MDR) and Portfolio Average Cumulative Abnormal Returns (PACAR) for portfolios of stocks sorted by Return on Equity (ROE) and Investment to Asset Ratio.
Focusing first on mean daily returns reported in Table 6, during the event window (column MDR), one notices that the patterns for ME, BE/ME, momentum and I/A are consistent with the full sample. Portfolios of micro, value, high momentum, and (investment) conservative stocks outperformed those of large, growth, low momentum, and (investment) aggressive stocks. For ROE, the authors observe a different picture than the usual pattern in that robust stocks (high ROE) underperform relative to weak stocks.
In Tables 7 & 8, the highest quintiles exhibit a negative and statistically significant abnormal return during the event window under the EW approach. Under the VW approach, the exception is the highest BE/ME quintile: value stocks experience a positive and significant abnormal return. The lowest quintiles either do not exhibit any abnormal return, which is statistically significant (I/A when EW, and momentum and ROE when VW), or experience an abnormal return that is not strongly statistically significant (ROE in EW, BE/ME and I/A in VW). These findings provide additional support for the benefit of separately examining the long and short legs of a factor related to a market anomaly.
Portfolios sorted on momentum exhibit an impact and order of magnitude higher than portfolios sorted on other characteristics. The MDR for the high momentum portfolios over the event window was 0.0143% (EW) or 0.0192% (VW). Corresponding, the average abnormal returns were −0.2938% or −0.2103%. These figures are even more impressive when comparing the difference between high and low momentum stocks. Even daily, abnormal returns are substantial. The daily abnormal returns are substantial and increase by approximately 40% when moving from the VW to EW portfolios. This is certainly consistent with the fact that momentum effects are often more pronounced in small stocks relative to big ones. Since, following the evidence reported above, micro, or small stocks are negatively and substantially negatively impacted by extreme weather events, this may explain the very low MDR together with substantial abnormal returns in the EW case.
The findings related to BE/ME also exhibit an interesting pattern. Growth stocks are always negatively impacted and statistically significantly during the hurricane periods. This is not the case for value stocks: the EW results suggest that they do experience a negative abnormal return while VW results suggest a positive abnormal return. Although the spread between value and growth stocks is positive in both weighting schemes, the implications are not the same. Once the authors control for size by moving to the VW approach, big stocks dominate, and their abnormal return is positive. One possible interpretation could be that value as a strategy is still attractive to investors even in turbulent environments, but they concentrate their investment in big value stocks that are higher quality than small value ones.
As for the ROE anomaly, high quintile portfolios (EW) experience strongly statistically significant negative abnormal returns. When comparing the EW and VW approaches, it seems that ROE performing stocks are negatively impacted in general and more so when those are small stocks. This finding seems consistent with the fact that growth stocks also experience negative abnormal returns. Every characteristic that includes a variable related to the future economic outlook of the stock seems to deteriorate in turbulent periods. Low ROE stocks are already under-performing in normal market conditions; hence it does come as a surprise that the lowest quintile abnormal return is borderline significant (EW) to insignificant (VW).
Finally, for the I/A anomaly, the picture is not encouraging for big stocks. The high quintile portfolio, hence, investment aggressive companies, exhibits negative abnormal return and more so for big companies (the spread in the VW case is higher in absolute value than the spread under EW). Consistent with the basic message of the CCAPM, aggressive investment increases the assets in place for a firm. As such, the firm is less flexible when it comes to adapting its production capacity to the new business outlook. Moderately engaged firms do not seem to be affected during hurricane periods.
It is worth looking at the high minus low spread since anomalies or factors are often investigated through a long/short portfolio return. While for BE/ME, momentum, and ROE one should look at high quintile minus low quintile portfolios, it should be the low quintile minus high quintile for I/A. There does not seem to be any cross-sectional difference in the behavior of stocks based on their I/A as the VW inter-quintile spread is not statistically significant. The reverse is true for the EW case: the authors observe a significant −0.0354% difference. For ROE, the spread is only highly significant for EW, which is a direct consequence of the decided significance of the high quintile leg. The value minus growth spread as well as high minus low momentum are positive and negative, respectively. Overall, the authors conclude that ROE and I/A related factors are likely to be insensitive to hurricanes, while size, BE/ME and momentum factors are extremely sensitive to these extreme weather events.
To summarize, major hurricanes strongly impact stock returns. Micro, growth, and high momentum stocks are impacted in a more intense way than small/big, value and low momentum stocks. The evidence is strong for micro stocks and one may suspect a flight to liquidity during extreme events.
Conclusions
The research concludes that ROE and I/A related long/short factors are insensitive to hurricanes, while size, BE/ME, and momentum-related factors are extremely sensitive to these extreme weather events. Long and short legs react differently, and high momentum stocks experience a negative impact on their returns in an order of magnitude greater than other stocks.
The story for value stocks is very promising. The paper’s findings suggest that not all disasters impact value stocks negatively: climate-related disasters seem to be beneficial to value stocks. This is probably because their business is stable and hurricane effects are transitory. Growth stocks, where valuation depends considerably on prospects, do seem to be extremely sensitive to perturbation of outlook.
Finally, a potential impact of climate change is an increase in the frequency and severity of extreme weather events. This paper paves the way to an interesting future investigation which may associate consumption growth crashes to extreme weather events.
This article is a summary of the paper entilted, "Market anomalies and disaster risk: Evidence from extreme weather events" co-authored by Abraham Lioui, Matt Lanfer and Mark Siebert, published in the Journal of Financial Markets.


