Style Factors in Emerging Asian Government Bond Markets


Special Issue - EDHEC PhD in Finance Newsletter - June 2020
Article signed by Cheryl Lim, EDHEC PhD candidate, Quantitative Strategist, Lucror Analytics, Singapore
Style Factors in Emerging Asian Government Bond Markets
This article is an abridged version of our working paper “Style Factors in Asian Government Bond Markets” (Lim & Lioui, 2020), where we examine the yield curve dynamics and premia in the China, India and Indonesia local currency government debt markets through the lens of Value, Carry and Momentum.
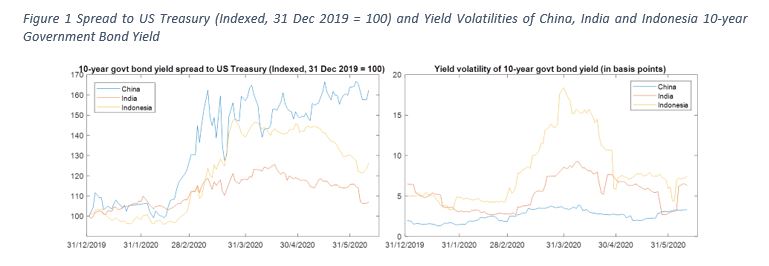
The Covid-19 pandemic has once again thrown emerging economies’ sovereign debt markets into the spotlight, showing how risky these governments’ debt really is. The three largest Asian emerging economies – China, India and Indonesia – were also among the hardest hit in Asia. The left panel of Figure 1 shows China, India and Indonesia’s 10-year government bond spread to the 10-year US Treasury, which, at the peak, was 1.2 to 1.6 times that at the end of 2019, while the right panel shows the yield volatilities[1] of the 10-year bond yields.
This is despite the fact that all three Asian emerging market sovereigns now borrow mainly in their local currencies to avoid the “original sin” of currency and maturity mismatches when borrowing in a foreign (or “hard”) currency (Eichengreen & Hausmann, 1999). (Carstens & Shin, 2019) argue that emerging economies with smaller domestic institutional investor bases and still dependent on foreign portfolio investors, have merely shifted the currency mismatches to the lender’s balance sheets, and, in the process, amplified the exchange rate risks of their investors to account for their returns in “hard” currencies. They call this “original sin redux”. Indeed, (AQR, 2018) finds that the alpha from active fixed income investing is really risk premium from taking emerging currency risk and corporate credit risk.
While “original sin redux” might be true of India and Indonesia, China, which has strict capital and exchange-rate controls and borrows mainly from state-owned or state-controlled financial institutions, also experienced a spike in government bond yields.
In this article, we examine the three Asian local currency government debt markets through the lens of investor behavior, using style factors to explain yield curve dynamics and premia in these bond markets.
Using Value, Carry and Momentum to measure Level, Slope and Curvature
Style factors, like Value, Carry and Momentum, are well established as important drivers of excess returns in equities and other asset classes including equity indexes, credit, commodities and currencies (see (Jegadeesh & Titman, 1993), (Fama & French, 1993), (Carhart, 1997), (Fama & French, A five-factor asset pricing model, 2015), (Asness, Moskowitz, & Pedersen, 2013), (Correia, Richardson, & Tuna, 2012), (Asness, Ilmanen, Israel, & Moskowitz, 2015), (Houweling & van Zundert, 2017), (Israel, Palhares, & Richardson, 2018), (Koijen, Moskowitz, Pedersen, & Vrugt, 2018), (Brooks, Palhares, & Richardson, 2018) among others). More recently, there is evidence that style factors also describe well developed market government bond risk premia, not just returns from a simple yield curve level shift but also the returns from changes in slope and curvature of the yield curve (Brooks & Moskowitz, Yield curve premia, 2017).
(Lim & Lioui, 2020) extends the tradition of style factor research even further to the Asian emerging local currency government debt markets of China, India and Indonesia. We explore how well Value, Carry and Momentum explain the excess returns from portfolios of three commonly used strategies that clearly explain yield curve dynamics. These are the level (long 10-year bond), slope (long 10-year bond and short 2-year bond) and butterfly (long 5-year bond and short an equal-duration weighted average of 2-year and 10-year bonds) portfolios.
We define Value, Carry and Momentum for the three portfolios in line with the literature albeit with a few innovations.
Value is usually defined as a measure that compares an asset’s market value to its fundamental or intrinsic value. Most researchers use expected inflation, either from investment bank inflation estimates (Asness, Moskowitz, & Pedersen, Value and Momentum Everywhere, 2013) or survey data (Brooks & Moskowitz, Yield curve premia, 2017), as the fundamental anchor.
We take a slightly different approach by using predicted yields from the Nelson-Siegel yield curve model (Diebold & Li, 2006) as fundamental anchor. This interpretation of Value is not only anchored to expected inflation, which the Nelson-Siegel level factor is closely linked to ( (Koopman, Mallee, & van der Wel, 2010) and (Evans & Marshall, 2007)), it is also value relative to the cross-section of bonds, i.e., relative to the market. This makes it even closer in spirit to Value used in the equity risk premia literature. At the same time, our definition is more suited for use with higher frequency data than bank estimates or survey data which are available at lower frequencies.
Carry is usually defined as the return an investor receives if market conditions remain constant, i.e., yield stays the same. We follow the literature and use the term spread or 10-year yield minus the local short (1-year[2]) rate, as our Carry factor.
The standard Momentum factor is defined as the one-year past return minus the last period return. We therefore use the 52-week return minus the last 1-week return (since our dataset consists of weekly data), adjusted for duration, as Momentum measure.
Table 1 shows our style factor definitions for the level, slope and butterfly portfolios where  is the n-year yield of country i at time t,
  is the predicted yield from the Nelson-Siegel yield curve model and
  is the 52-week annualized return minus the last 1-week annualized return of the -maturity bond. All durations are scaled to constant D.
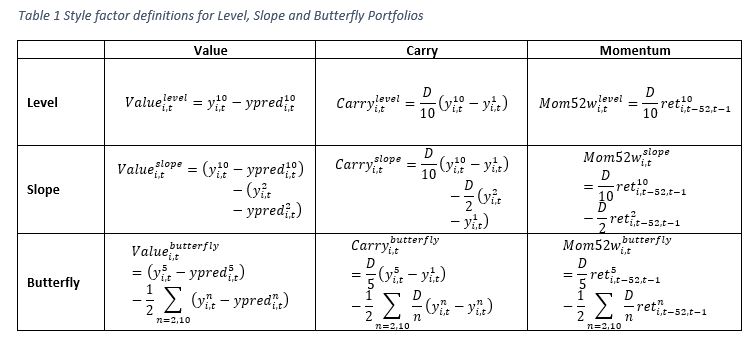
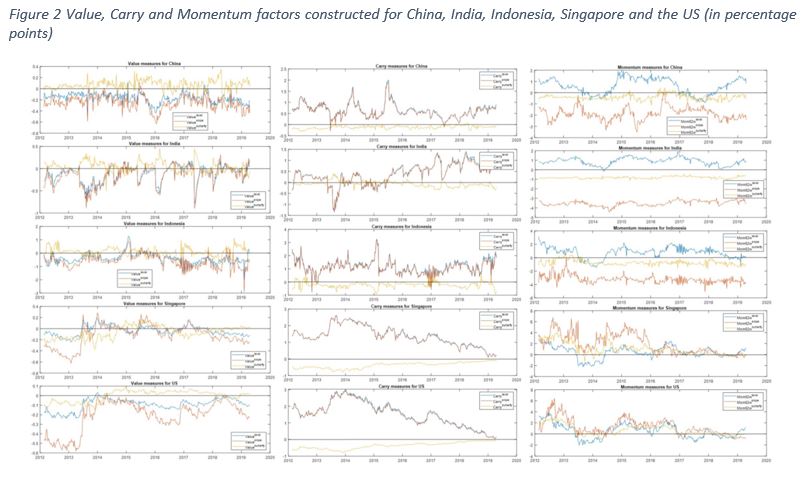
Figure 2 shows the style factors constructed for each country’s level, slope and butterfly portfolios, with factors for Singapore and the US, constructed in the same manner, included for contrast. We clearly see that there are commonalities across the three Asian emerging economies, and clear differences with more developed bond markets.
Value is most economically important, while Carry and Momentum are common factors robust to other factors
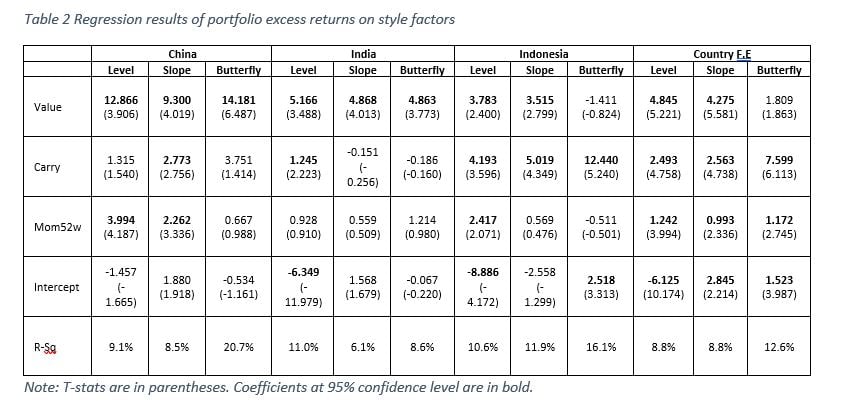
Using annualized weekly excess returns from Feb 2012 to Apr 2019[3], we find that the style factors explain a sizeable 6.1%-20.7% of excess return variation of these portfolios (Table 2), in stark contrast to the less than 3% R-squared for the Singapore and US markets (see (Lim & Lioui, 2020) for detailed results). More notably, the style factors explain all the excess return variation in the China portfolios, i.e., with no significant intercepts, as well as, for India’s slope and butterfly, and Indonesia’s slope.
Value is significant for all portfolios except Indonesia’s butterfly and is the most economically important factor for China and India with the highest coefficients among the style factors for all three portfolios. Carry, however, is the most economically important for Indonesia with higher significant coefficients than Value in Indonesia’s portfolios. Momentum is significant only for China’s level and slope, and Indonesia’s level, but less economically important than Value and Carry.
Using a country fixed effects model, we find that the style factors explain 8.8%-12.6% of the excess return variation across the three countries with Value most economically important for level and slope portfolios and Carry most economically important for the butterfly portfolio.
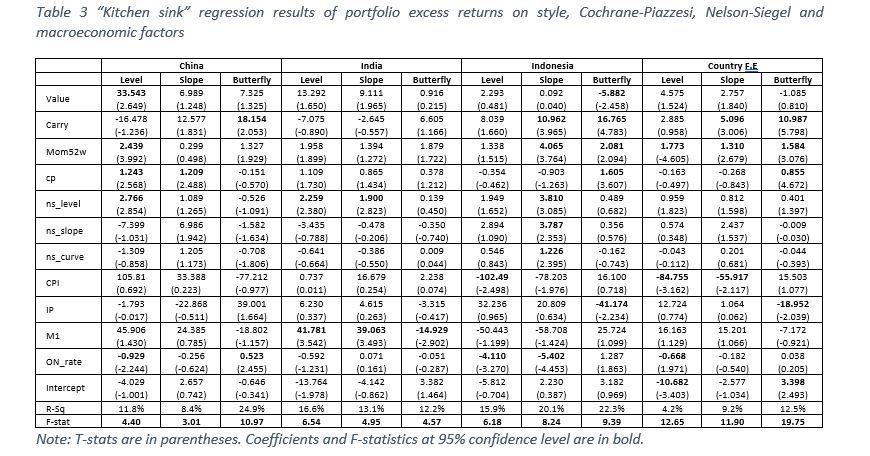
We perform “kitchen sink” regressions (Table 3) with all commonly used factors in the bond premia and term structure literature to understand if the style factors are robust to these factors. These factors are the Cochrane-Piazzesi factor (Cochrane & Piazzesi, 2005), the Nelson-Siegel factors[4] (Diebold & Li, 2006), and macroeconomic factors that capture inflation, output growth, money supply and short-term interest rates in these economies.[5] The F-statistics of all the models are significant and explain all the excess return variation in the individual country portfolios, i.e., with no significant intercepts.
We see that there are instances where the style factors are subsumed by other factors, and these vary by country and portfolio. Value and Momentum continues to be significant for China’s level portfolio, while Carry is significant for the butterfly portfolio. Carry and Momentum are significant for Indonesia’s slope portfolio, while all three style factors are significant for the butterfly portfolio.
India presents the most interesting case where none of the style factors are significant, and Money Supply (M1) is the key, sole determinant, in the case of India’s butterfly, of excess returns variation.
The country fixed effects models show that Carry and Momentum are the significant style factors that are not subsumed by the other factors.
While the results here show that macroeconomic factors play a distinct role in explaining excess return variations, in regressions with macroeconomic factors only, these factors explain almost no excess return variation with no significant factors (see (Lim & Lioui, 2020) for details). Taking the two sets of results together, it appears that the “noise” from the style and other factors obscure the macroeconomic effects and these become apparent after controlling for that “noise”.
The CPI Index, Industrial Production Index, M1 and the average if the Indonesia Overnight Rate (IndONIA) and the Jakarta Interbank Offered Rate (JIBOR) for Indonesia. We use the log first-order difference for CPI, IP and M1, and the original data series for Overnight Rate, and incorporate the announcement lag taking into account the fact that the announcement lag is different for each country and data series.
Conclusion and implementation implications
Taken together, it is clear that investor behavior, as measured by the style factors, is a key driver of yield curve dynamics and excess returns. While Value, investors buying low and selling high, is the main driver in all three markets and for almost all three portfolios, it is subsumed by other factors, i.e., In many cases value is really a proxy for other factors. Carry and Momentum, on the other hand, are common factors driving excess returns across the three markets, and robust to other factors.
While simple, this study sheds light on the style factors that drive excess returns and yield curve premia in the Asian emerging local government debt markets of China, India and Indonesia, and the nature of these factors. More importantly, for the practitioner, the style factors offer a proxy for hard-to-measure macroeconomic indicators, that can only be measured at a lag.
[1] Yield volatility is defined as the standard deviation of daily yield changes over the last 21 trading days. Low yield volatility implies that yields are relatively stable around average yields and therefore a relatively liquid market, while high yield volatility indicate less predictable movement in bond yields and therefore a less liquid market
[2] We use the 1-year instead of 3-month year due to data availability.
[3] We use unsmoothed zero-coupon yields bootstrapped using the Fama-Bliss method (Fama & Bliss, 1987) from local currency government bond data obtained from Bloomberg.
[4] We use the Nelson-Siegel factors, in lieu of the more commonly used principal components, to explain yield curve variation since Nelson-Siegel is cross-sectional and therefore the issue of in-sample/out-of-sample testing does not arise. The main paper, (Lim & Lioui, 2020), shows that the analysis is robust to using either Nelson-Siegel factors or principal components.
[5] We use the local equivalent of the macroeconomic factors for each country, which are the Consumer Price Index, Value-add of Industry, Money (M1) Supply, and the Shanghai Interbank Offered Rate (SHIBOR) for China, the Consumer Price Index – All Items, Industrial Production Index, M1 for India National Currency, and Central Bank Rates for India – Immediate Rates: Less than 24 Hours for India, and the CPI Index, Industrial Production Index, M1 and the average if the Indonesia Overnight Rate (IndONIA) and the Jakarta Interbank Offered Rate (JIBOR) for Indonesia. We use the log first-order difference for CPI, IP and M1, and the original data series for Overnight Rate, and incorporate the announcement lag taking into account the fact that the announcement lag is different for each country and data series.
References
AQR. (2018). The Illusion of Fixed Income Alpha. AQR Alternative Thinking.
Asness, C. S., Ilmanen, A., Israel, R., & Moskowitz, T. J. (2015). Investing with style. Journal of Investment Management, 27–63.
Asness, C. S., Moskowitz, T. J., & Pedersen, L. H. (2013). Value and Momentum Everywhere. The Journal of Finance, 929-985.
Brooks, J., & Moskowitz, T. J. (2017). Yield curve premia. Working paper.
Brooks, J., Palhares, D., & Richardson, S. A. (2018). Style investing in fixed income. Journal of Portfolio Management, 127-139.
Carhart, M. M. (1997). On Persistence in Mutual Fund Performance. The Journal of Finance, 57–82.
Carstens, A., & Shin, H. (2019). Emerging markets aren't out of the woods yet. Foreign Affairs.
Cochrane, J., & Piazzesi, M. (2005). Bond Risk Premia. American Economic Review, 138-160.
Correia, M. M., Richardson, S. A., & Tuna, A. I. (2012). Value Investing in Credit Markets. Review of Accounting Studies, 572–609.
Diebold, F. X., & Li, C. (2006). Forecasting the term structure of government bond yields. Journal of Econometrics, 337-364.
Eichengreen, B., & Hausmann, R. (1999). Exchange Rates and Financial Fragility. Proceedings - Economic Policy Symposium - Jackson Hole, Federal Reserve Bank of Kansas City, 329-368.
Evans, C. L., & Marshall, D. A. (2007). Economic determinants of the nominal treasury yield curve. Journal of Monetary Economics, 1986-2003.
Fama, E. F., & French, K. R. (1993). Common risk factors in the returns on stocks and bonds. Journal of Financial Economics, 3-56.
Fama, E. F., & French, K. R. (2015). A five-factor asset pricing model. Journal of Financial Economics, 1-22.
Fama, E., & Bliss, R. R. (1987). The Information in Long-Maturity Forward Rates. American Economic Review, 680–92.
Hofman, B., Ilhyock, S., & Hyun Song, S. (2019). Bond risk premia and the exchange rate. BIS Working Papers No 775.
Houweling, P., & van Zundert, J. (2017). Factor Investing in the Corporate Bond Market. Financial Analysts Journal, 100–115.
Israel, R., Palhares, D., & Richardson, S. A. (2018). Common factors in corporate bond returns. Journal of Investment Management.
Jegadeesh, N., & Titman, S. (1993). Returns to buying winners and selling losers: Implications for stock market efficiency. The Journal of finance, 65-91.
Koijen, R. S., Moskowitz, T. J., Pedersen, L. H., & Vrugt, E. B. (2018). Carry. Journal of Financial Economics, 197-225.
Koopman, S. J., Mallee, M. I., & van der Wel, M. (2010). Analyzing the Term Structure of Interest Rates using the Dynamic Nelson-Siegel Model with Time-Varying Parameters. Journal of Business & Economic Statistics, 329-343.
Lim, C. K., & Lioui, A. (2020). Style Factors in Asian Government Bond Markets. Working Paper.
This article is an abridged version of working paper “Style Factors in Asian Government Bond Markets” (Cheryl Lim & Abraham Lioui, 2020), where they examine the yield curve dynamics and premia in the China, India and Indonesia local currency government debt markets through the lens of Value, Carry and Momentum. Pdf is available here.


