Want to be ahead of the pack on data analytics and visualisation?


‘Data is the new oil’ is a sentence on everyone’s lips. The Economist even says that ''the world’s most valuable resource is no longer oil, but data". We all produce a lot of data, be it on our phones, when browsing the web, or even when driving. In the future, we will use more and more connected devices and more digitalised services, leading to the generation of even more data. Cisco predicts that global data-centre traffic will increase by 45% by 2021, just two years from now.
Companies that know how to use this data have a major competitive advantage. We all have heard how data can help companies to:
- better understand their customers
- target prospects
- ease and speed up the sales process
- automate processes that used to be manual
DATA VISUALISATION MADE EASY
However, we are barely starting to use the full potential of data. Only a few companies use their data to make fact-based decisions. One of the reasons is that the data tends to remain in the hands of a few specialists, known as data scientists, which not all companies can afford. The challenge today is to give all business users access to this data – and that is the goal of a new type of software called self-service business intelligence (BI) software.
The BI market leader is Tableau Software, with more than eight million users, according to Capterra. This solution is used by Apple, Amazon, Criteo and many more global corporations to analyse and visualise their data and leverage it for operational improvement. As a result, the skills required to use this type of software are in high demand. For example, in 2018, the second-most sought-after skill on LinkedIn, according to inc.com, was statistical analysis and data mining, while the seventh-most in-demand skill was data presentation.
"This is why I teach data visualisation with Tableau software to students on EDHEC’s MSc in Data Analytics & Artificial Intelligence and Global MBA courses, says Yvan Fornes, Business Analytics Consultant at Amadeus, Tableau Zen Master, and lecturer at EDHEC. I use Tableau software at work every day as a business consultant at Amadeus, the leading IT solutions provider for the travel industry. My teaching approach mixes theory and practice. When teaching software, practice is key." To encourage the students to use Tableau software as much as possible, Yvan Fornes askes them to:
- Deliver a data visualisation before class so they can learn the basic concepts by themselves. There is a lot of content online that they can draw on (videos, exercises, examples). This way, when they come to class, they are prepared and ready to ask questions.
- Understand the key concepts, explain them in a few slides in class, materialise them in a demonstration and test them through software exercises.
- Take part in a Data Visualisation Challenge organised in association with Tableau and Amadeus.
THE DATA VISUALISATION CHALLENGE
The rules of the challenge are very simple: choose a question and answer it with data visualisation. You are free to choose any public data sets.
The visualisations are graded and the top three receive prizes from Amadeus and Tableau.
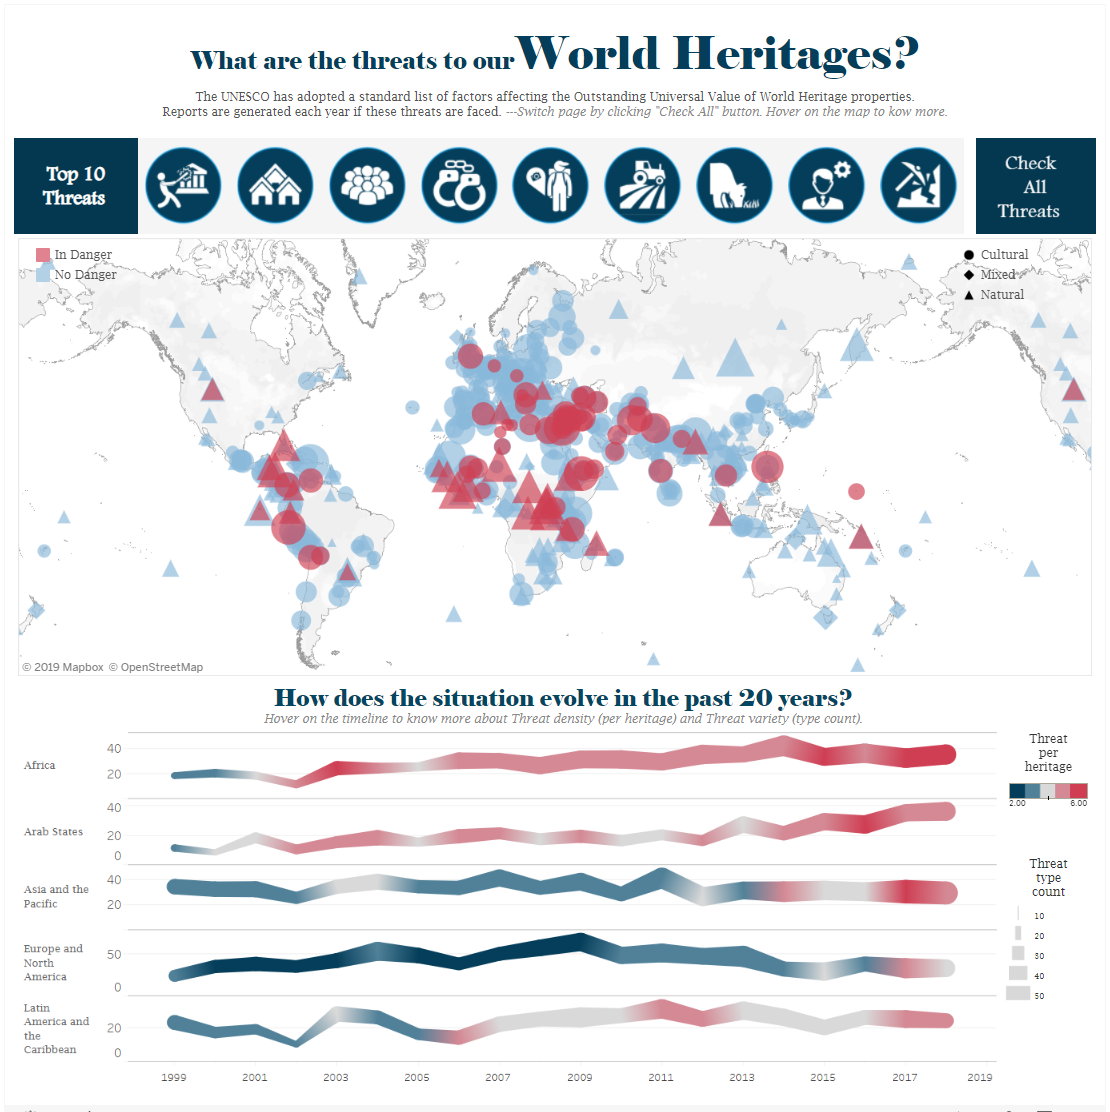
Qianyin Xue, Chinese won this year’s challenge with his data visualisation of world heritage protection, a meaningful choice after the Notre Dame de Paris tragedy.
“As a business school student, I find data visualisation very important for my future career,” Qianyin said. “Nowadays, data is everywhere and key to business decisions. Good data visualisation can help increase the overall efficiency and effectiveness of one’s work, whether you are working at the strategic or at the operational level."
“At the strategic level, graphs and charts can provide a much clearer view of the big picture, as well as the key figures in detail,” Qianyin continued. “Instead of digging into a table full of numbers, you can focus on the most important elements (key performance indicators, important trends, etc.). Sometimes, data visualisation can provide useful insights that are difficult to achieve with plain numbers. At the operational level, data visualisation is a straightforward and lively way of giving visibility to work. It is a good way to increase the efficiency of communication, especially when presenting results and findings with logical complexity.”
So, what was the main takeaway for this prize-winning MSc in Data Analytics & Artificial Intelligence student?
“I have learnt many advanced-level data-visualisation skills, thanks to the detailed examples provided by Mr Fornes”, Qianyin said. “However, the most important takeaway for me has to do with mindset: that of ‘skilful simplicity’. This course has taught me that data visualisation is not about showing everything, but about showing important information to the right people in an efficient and effective way.”
"This year, concludes Yvan Fornes, I was really impressed by the quality of the visualisations submitted, especially as this was the first year the students had used the Tableau solution and I had given them only 30 hours of class. The three winners were able to produce engaging visualisations that focused on a precise objective: to help answer a question or make a decision."
Related resources:
DataViz Challenge, first edition
Open innovation: shaping the future of telecoms
Brand new e-learning course on coding
MSc in Data Analytics & Artificial Intelligence ranks 2nd in France by QS


