
Nicolas Schneider: "EDHEC-CLIRMAP shows a geography of physical risk and its macroeconomic implications across different warming futures"
In this interview, Nicolas Schneider, Senior Research Engineer/Macroeconomist at the EDHEC Climate Institute, presents EDHEC-CLIRMAP (i.e., EDHEC-CLimate-Induced Regional MAcroimpacts Projector) (1). Accessible online to everyone, this interactive tool offers, for the first time, a detailed geographical visualisation of the potential future macroeconomic damage caused by climate risk.

- (Webinar) On February 3, 2026, Nicolas Schneider is giving an online seminar entitled "Mapping a Geography of Physical Risk and its Macroeconomic Implications Across Different Warming Futures: Introducing EDHEC-CLIRMAP" - https://climateinstitute.edhec.edu/events/mapping-geography-physical-risk-and-its-macroeconomic-implications-across-different-warming
Over the past 15 years, the quantification (and projection) of the macroeconomic impacts of “physical” climate risk has undergone a revolution. Could you tell us more?
The general, and intuitive, relationship between anthropogenic emissions, rising average temperatures, and the resulting macroeconomic damages stems from highly complex mechanisms. The scientific literature defines damages as the percentage deviation of GDP relative to a reference scenario or a historical baseline period.
Until roughly 15 years ago, the approach to physical climate risks in macroeconomics was largely global. Knowledge was limited to aggregated predictions, providing little or no insight into the geographical distribution of climate change impacts across continents, countries, or even within countries.
The initial approach developed by Nordhaus (1991) enabled the development of an initial analytical framework and the creation of DICE models (2). Useful but criticised (3), particularly for their lack of empirical basis and their assumptions deemed excessively conservative, they have been refined by Weitzman (2010) (4), among others.
In 2015, Burke and his co-authors delivered a pioneering study, providing new and valuable insights into the distribution of climate-induced damages to GDP across countries. Their main finding intuitively highlights a non-linear relationship between average temperature and GDP growth. It also highlighted the heterogeneity of future damages depending on each country’s starting point (that is, its historical temperature or “baseline”) along this inverted U-shaped curve. To this end, they propose a doubly innovative methodology, which (i) enriches the underlying macro-econometric model while (ii) considerably simplifying the construction of projected damage to GDP by 2100 (5).
Closer to us, in 2024, Kotz and his co-authors (6) revolutionised climate damage analysis by proposing the first intra-country distribution, incorporating more climate variables (known as factors) and persistence effects. This represents a major methodological and empirical advance: the latest report from the Network for Greening the Financial System (NGFS, Phase V), whose work is particularly useful for central banks, public decision-makers and investors, drew on the results of this study to calibrate its new chronic physical risk module.
So your own work is part of this scientific trajectory?
Absolutely. For EDHEC-CLIRMAP, we use more granular historical climate data (7) and extend the work of Burke and Kotz, projecting our damage estimates to 3,600 sub-national regions representing 95% of global economic output. We also propose a new methodological framework (8) for producing disaggregated projections of climate-induced economic damage.
In addition, we simplify the visualisation (and therefore communication) of our findings, while offering users the opportunity to intuitively explore the story they tell.
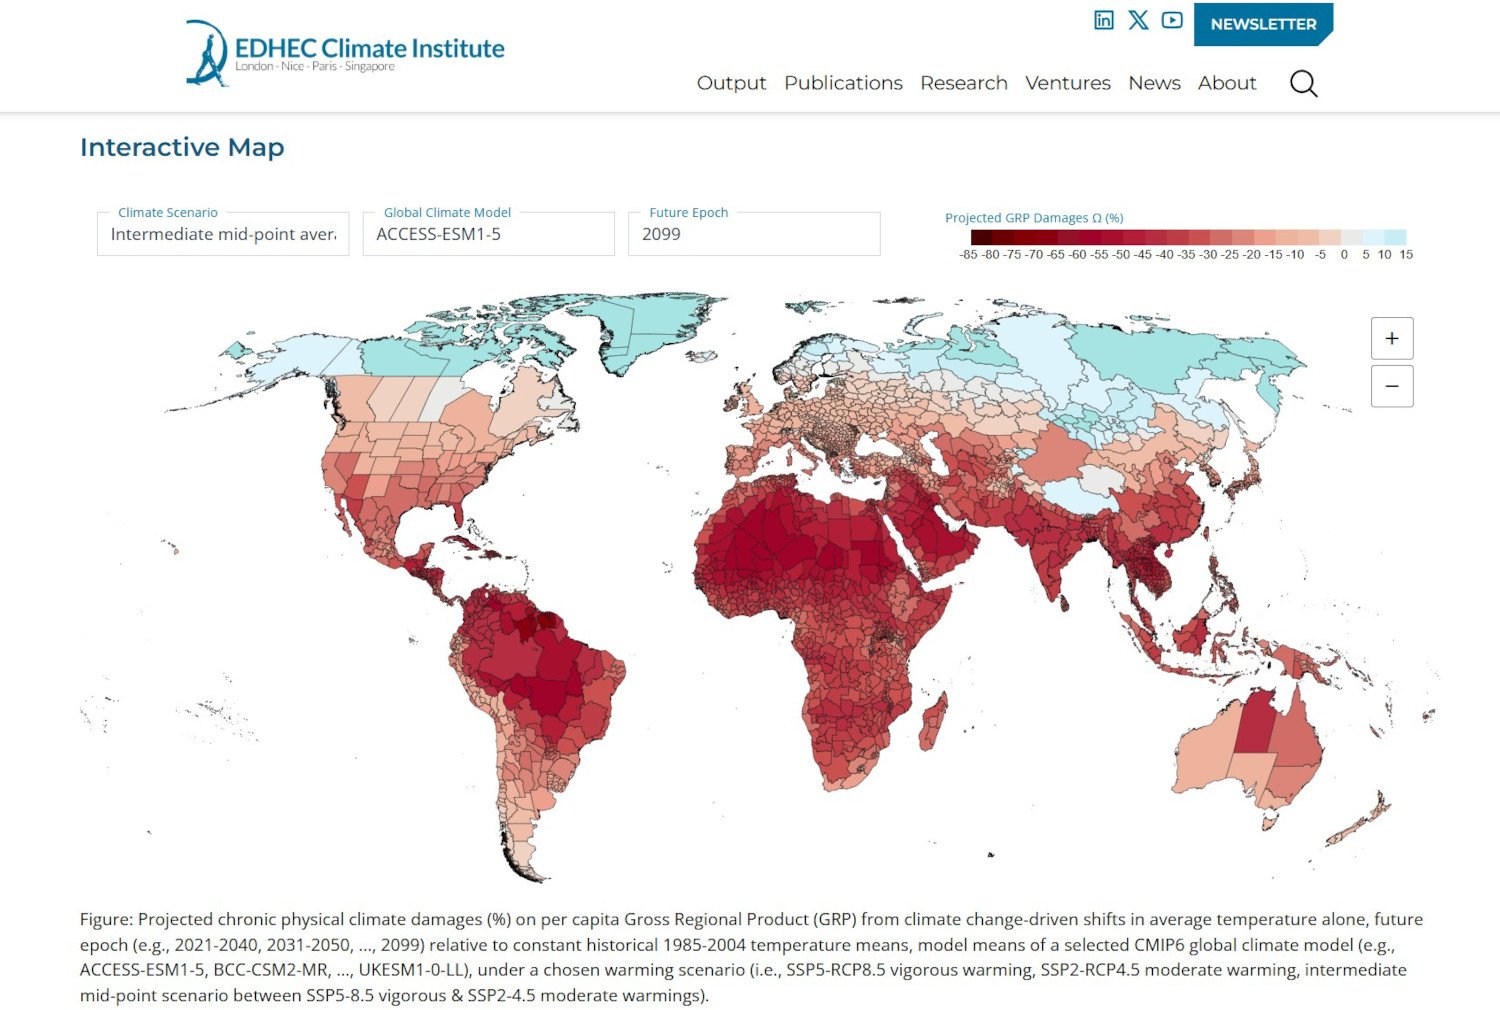
In short, EDHEC-CLIRMAP is presented as an interactive world map, where the colour gradient illustrates the (uneven) geographical distribution of future GDP deviations attributable solely to the rise in average temperatures (i.e., the central component of chronic physical risk) (9) in a context of climate change.
EDHEC-CLIRMAP is a unique proposal, but one that is part of a broader movement, is that correct?
EDHEC-CLIRMAP is, in fact, the culmination of a colossal effort: our own work at EDHEC Business School and the EDHEC Climate Institute, of course, but also that of hundreds of scientists worldwide. We follow an incremental approach (fortunately) building on prior peer-reviewed studies and publicly available data.
This tool lies at the intersection of several disciplines: macroeconomics, econometrics, and climate science. Its hybrid nature reflects the ongoing multidisciplinary revolution in climate research. Climate change, by its very nature a global problem, cannot be understood solely through standard equilibrium price adjustment mechanisms; it represents a risk to existing economic and sectoral systems and demands a transdisciplinary scientific response.
Whether in public research departments or private institutes, work now increasingly combines approaches that previously operated independently (perhaps for the first time) and EDHEC-CLIRMAP is part of this momentum.
How did you develop this tool?
The execution of this project had to overcome new challenges (at least for economists, though familiar to data scientists) such as the issue of dimensionality: handling, manipulating, and performing operations on extremely large data matrices required specialised programming and the use of high-performance computing systems (supercomputers) to process data of the order of terabytes. This highlights the fact that the local heterogeneity of climatic and economic shocks requires a radical revision of aggregate estimates.
As an example, consider our exercise in projecting macroeconomic damages. This required the prior integration of data from NASA’s NEX-GDDP CMIP6 climate simulations. These datasets provide, for each of the 249,000 unique grid cells covering the Earth’s surface, daily average temperature simulations (365 days), differentiated across 29 climate models (GCMs) and two major climate scenarios (SSP-RCPs), totalling approximately 5.4 billion data points per year. Covering the period from 2025 to 2100, our analytical framework required processing roughly 400 billion data points for the “future” segment of the damage calibration in the EDHEC-CLIRMAP project [8].
You can test it by visiting the online tool. EDHEC-CLIRMAP allows you to vary different parameters (time horizon, models, scenarios) and view the results on an unprecedented scale: the equivalent of the Sangha region in the Democratic Republic of Congo, Lampang in Thailand, Kostroma in Russia, or PACA in France.
What can we see? A colour gradient (from blue to red) corresponding to the magnitude of damage (%) projected on gross regional product (GRP) per capita, attributable solely to variations in average temperature (10), for a selected future ‘target’ period, climate model, and warming scenario.
Who might be interested in EDHEC-CLIRMAP?
We have just launched this tool online, and it is already attracting significant interest: several dozen consultants, investors, asset managers, and fintech professionals have contacted us. However, we believe that EDHEC-CLIRMAP’s audience extends far beyond the financial sector. It can be of interest to the general public, including students, policymakers, local elected officials, researchers, and many others.
EDHEC-CLIRMAP illustrates a projected future, but not an inevitable one: a future that still depends in part on the choices we make today. It also highlights the importance of funding regionally informed adaptation strategies, as the tool identifies areas where net winners and losers, in absolute terms, may emerge.
Anyone can now explore these projections and gain a better understanding of the economic stakes of climate change and its potential macroeconomic implications. Depending on your profile, please feel free to contact us: we provide more detailed data and analyses tailored to different use cases.
Notes & references
(1) EDHEC-CLIRMAP (EDHEC-CLimate-Induced Regional MAcroimpacts Projector) is an interactive tool accessible on the internet and developed by the EDHEC Climate Institute - https://climateinstitute.edhec.edu/data-visualisations#edhec-clirmap
(2) The DICE (Dynamic Integrated model of Climate and the Economy) model developed by William Nordhaus in the 1990s was one of the first integrated models for economic assessment of the climate, and served as a reference and methodological starting point for many subsequent IAMs (Integrated Assessment Models). However, not all IAMs are direct descendants of DICE; some, such as FUND (Policy Analysis of the Greenhouse Effect) and PAGE, were developed independently and have different structures.
See also: Pierre Matarasso. Presentation of two emblematic models for analysing economic policies on climate change: MARKAL and DICE. Alexandre Koyré Centre Workshop, ‘Models and Complex Systems, Global Climate Change,’ September 2003 - https://shs.hal.science/halshs-00007214/
(3) See Robert S. Pindyck (2013): « …damage functions used in most IAMs are completely made up, with no theoretical or empirical foundation » - https://web.mit.edu/rpindyck/www/Papers/PindyckClimateModelsJELSept2013.pdf
(4) Weitzman, M. (2010). What is the “damage function” for global warming- and what difference does it make?, Climate Change Economics 1, 57-69 - https://www.worldscientific.com/doi/abs/10.1142/S2010007810000042
(5) These are new panel econometric methods linking annual series of GDP per capita to plausibly exogenous fluctuations in average temperature. Burke, M., Hsiang, S. & Miguel, E. Global non-linear effect of temperature on economic production. Nature 527, 235–239 (2015) - https://doi.org/10.1038/nature15725
(6) Kotz, M., Levermann, A. & Wenz, L. The economic commitment of climate change. Nature 628, 551–557 (2024). https://doi.org/10.1038/s41586-024-07219-0
(7) EDHEC-CLIRMAP uses NASA GLDAS—i.e., surface temperature and precipitation data on a 0.25° x 3-hour grid from NASA's Global Land Data Assimilation System (GLDAS). In comparison, Kotz et al. (2024) use daily historical data on a 0.5° grid from W5E5—a merged dataset combining WFDE5 data on land with Copernicus ERA5 data on oceans.
(8) Cf. ‘EDHEC-CLIRMAP: EDHEC-CLimate-Induced Regional MAcroimpacts Projector. The Macroeconomic and Econometric Background’. Here: https://climateinstitute.edhec.edu/sites/default/files/2025-07/ECI_Macroeco_Econometric_Background_EDHEC-CLIRMAP.pdf
(9) Chronic physical climate risks refer to long-term shifts in climate patterns, including rising temperatures, sea level rise, longer periods of drought and ecosystem transformations, which gradually affect sectoral productivity, asset values and financial stability.
(10) More specifically, the colour gradient (from blue to red) corresponds to the magnitude of damage (%) projected on gross regional product (GRP) per capita, attributable solely to variations in average temperature (relative to historical 1985–2004 values, “the” central component of chronic physical risk), for: (i) the future “target” period, (ii) the climate model, and (iii) the warming scenario selected upstream.
Further reading – some additional references
Dell, M., Jones, B. F., & Olken, B. A. (2014). What do we learn from the weather? The new climate-economy literature. Journal of Economic literature, 52(3), 740-798.
Nordhaus, W. D. (1991). To slow or not to slow: the economics of the greenhouse effect. The economic journal, 101(407), 920-937.
Schötz, C. (2025). Spatial correlation in economic analysis of climate change. Nature, 644(8076), E27-E30.
![[2/2] Around the word: Scandal - C. Collard: “Legal risk management and reputational risk management are two sides of the same coin”](/sites/default/files/styles/actu_850_480/public/2026-07/2026-07-header-vox-scandal-collard.jpg?itok=GHE-Ijk3)

